A Celebration of Nations: The Olympics by the Numbers
In honor of the Olympics, let’s take a break from supply chain woes and crash projections and celebrate the world in the only way we know how; with sheer, unrelenting, competitive comparisons. In our global community of breathtaking diversity, let’s spotlight just how difficult it is to become a major national powerhouse and find correlation between athletic accomplishment, population statistics, urban planning, GDP and Healthcare spending.
(Before we get started, please forgive my poor chart making and SQL skills.)
Population Representation1
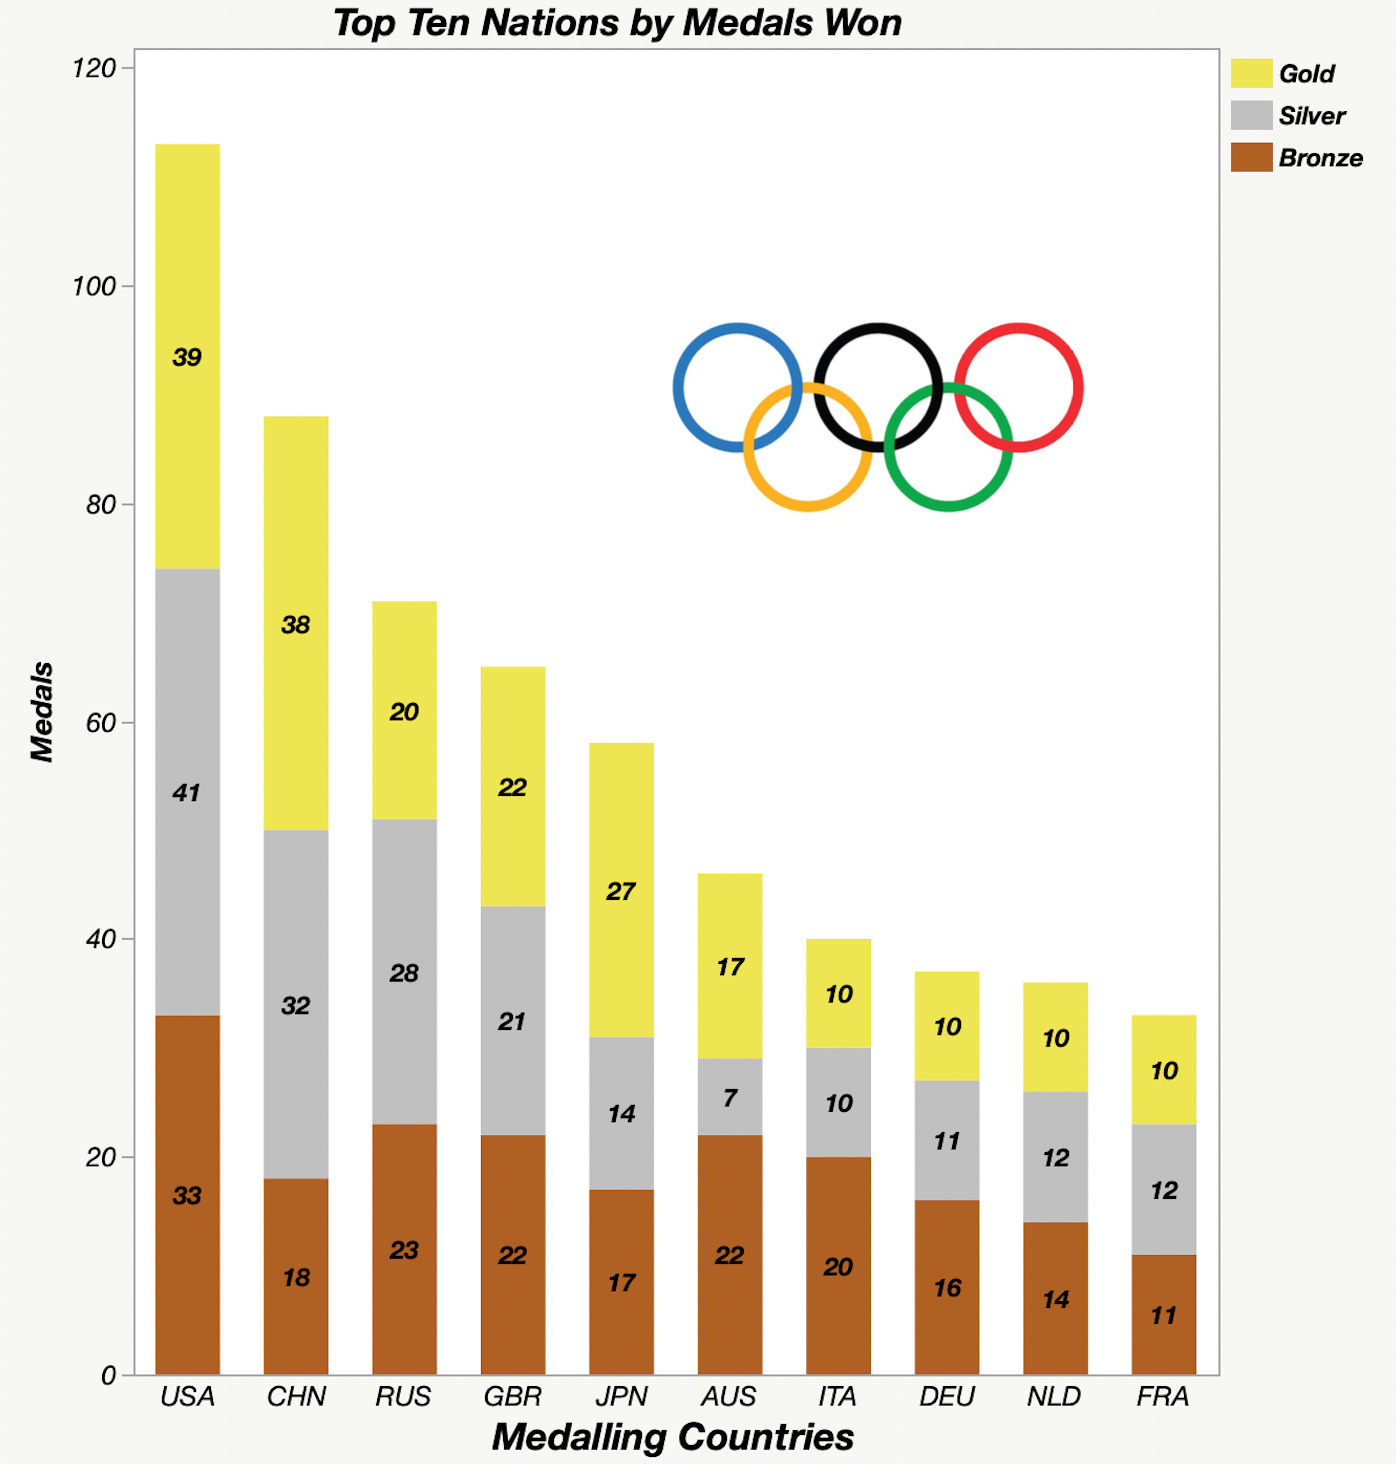
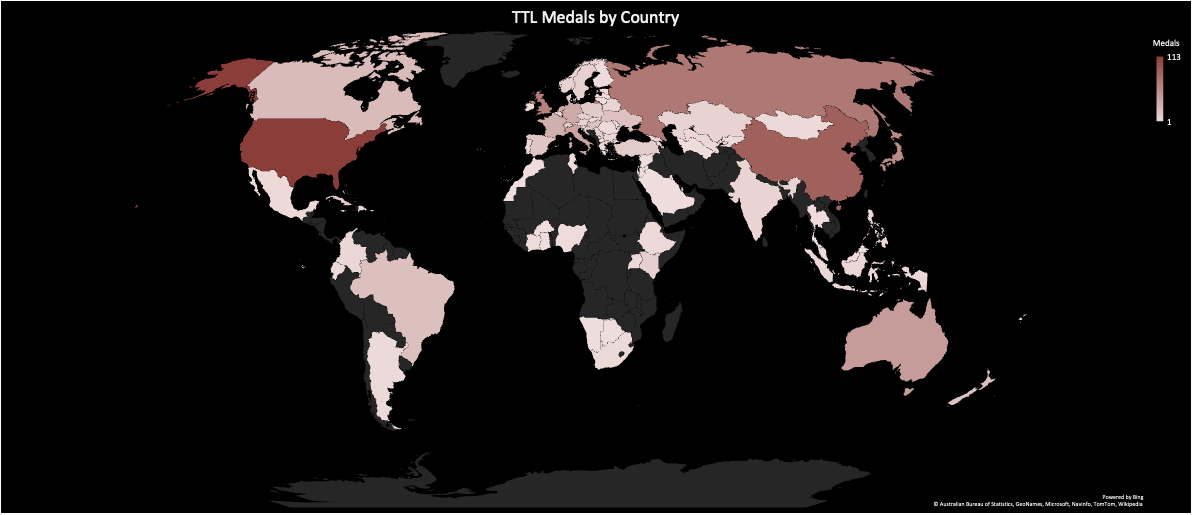
Of the 206 countries that competed in the Japan 2020 Olympics, 92 countries took home at least one of the 1080 medals. Of these 92 countries, the ten largest medal collectors accumulated 587 pieces of hardware, more than 55% of all attainable pole positions. 77% of the global population was represented within these 92 representative countries, and only 30% of the world population lives within the top ten nations.
The Urban vs Rural ratio has long been a strong indicator of national commerce and development. Among the top medalling nations, city dwellers make up 70% of the total populace, whereas only 53% of the remaining field live in cities. This lack of urbanism deters large swaths of people from even the most remedial introduction to athletic opportunity, let alone the ability to afford it.
GDP & Healthcare:
GDP (Total and Per Capita)3
All medalling nations account for 77% of total worldwide population yet they represent 92% of the total worldwide Gross Domestic Product
The top ten nations represent 29.4% of total population but also control a whopping 64.4% of total GDP
The remaining field represent 44.2% of total population yet only 27.7% of total GDP
Total worldwide per capita GDP is $11,417, whereas total medalling nations average per capita GDP is $13,252
The Top ten nations average per capita is $24,273 with the US leading $65,263
The remaining field’s average per Capita GPA amounted to a jarring $6,454
Life Expectancy4
Average worldwide life expectancy is 72.6 years of age
Top ten nations had an average life expectancy of 80.6 years however the top three over achievers falling short of the average., while Japan hit 84.4.
USA: 78.8
China: 76.9
Russia: 73.1
The remaining field of contenders had an average Life expectancy of 74.8 (not taking into account olympic hopefuls that did not achieve medal)
Healthcare and Spending5
Average healthcare spending per capita worldwide is 5.9% of total GDP or an average of $1,111 person citizen
For the top ten nations that number balloons to ~6.8% of total GDP or $4,500 per person
In the remaining field that number falls to 3.9% of total GDP and $1,450 per citizen.
Out of Pocket Healthcare expense is currently $201 per capita worldwide or 1.8% of total GDP
Top ten nations OoP healthcare costs are ~$619 or 1.6% of total GDP
The remaining field’s OoP costs are $305 per capita or 4.7% of total GDP

The Obstacles to Olympic Glory
As the Olympic games remain an old boys club driven in large part by occidental influence, less established nations will continue to celebrate their smaller victories against the reining Goliaths. Unlike in fables, there aren’t many Cinderella stories at the Olympics.


